Let’s help you understand and interpret insights from Calculus and supercharge your Hiring Strategy!
We have taken an example of the role of "Brand Manager"
1. Quick Stats
Median Experience: 9 years
Median Salary: 38 Lacs
With This insight, you understand the Median of the entire sample set i.e. where maximum candidates lie.
2. Availability Duration Insight
This Insight helps you understand the Average notice period of candidates.
One can see how quickly you can onboard post-hiring by looking at candidates’ supply-side and notice period of candidates.
Since every recruiter might have deadlines to close a certain position, this insight would help them to analyse the average turnaround time for hiring.
Here, 46.9 % of people have a notice period of 2+ months, and 6.4 % would be immediately available etc.
3. Gender Distribution
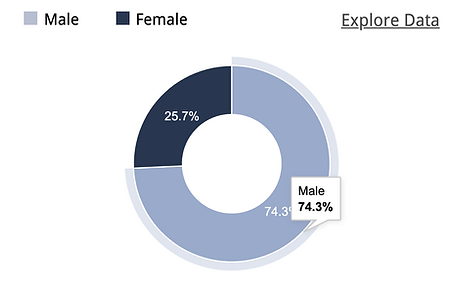
This widget shows how the entire sample is distributed basis gender.
Here, 24.6% of Female Candidates are available.
One can work around this and modify with the business teams basis the availability of diversity for this role.

4. Distribution of profiles based on Salary
This insight helps you with Salary wise distribution in the market.
We can see where the maximum chunk of candidates lies, under which Salary bucket for instance, here 34% of people are working in 27-39 Lacs of CTC.
Further, one can see a distribution of female & male candidates in each salary bracket.
The widget also shows the Mean, Median Salaries and Standard Deviation where Median represents the mid-point of the Salary range.

5. Distribution of profiles based on Expected Salary
Here we see the expected CTC of candidates on the lookout and thus helps you to understand the market sentiment for this skillset.
The graphs are clickable and help you backtrack to narrow down to the profiles falling under your budget since there are different budgets for different roles and levels across the organisation.

Quick Tip
Want to Discover what % hike should you offer to a New Employee?
Just compare the Median Salary of Current CTC v/s Expected Salary to find the Average % change in the market.
6. Distribution of profiles based on Experience
This insight details how salary changes as experience increase. One can look at median salaries of entry-level roles vs those in Leadership roles.
The line graph shows the median salary points in each of the Experience Brackets.
Each bar graph also shows what % of people are available in that experience level and the gender diversity.

7. Distribution of profiles based on the average tenure
Looking for when should you start building a pipeline? What is the average attrition rate for a particular skill set?
Well, the graph shows the average tenure of candidates in a particular role which helps us in understanding the attrition level in the market.
Looking at the peak of the line chart, almost 45% of people have an average tenure of about 2 years.
They might move to a different company or at a different succession ladder in the same company.
So, you could probably look at this as an opportunity to build a pipeline for the next set of candidates to stay ahead of the curve.

8. Demand trend for last 6 months
Let us look at how the demand for this role has been changing (basis the number of jobs posted on the platform)
Here we see relatively constant demand for this role, with 74 jobs being posted in July vs 98 in Dec.
This insight could help you understand:
-
In the long run if any skills/. technologies are having less demand they might be getting obsolete or are currently not being hired for
-
Having a spike might mean demand for that particular is the role and you might have to shell out more money for hiring candidates of your choice because everyone is hiring for those.

9. Popular Companies
This shows the top 6 popular companies where these skillset/ profiles are working and the % of profiles in each of them.

10. Geographical distribution of profiles
Let's look at the Key Insights:
National Median Salary: 38 Lacs
The second column shows how talent is distributed across differently/ supply of candidates.
One can understand if there is a need for relocation in case of less Talent pool available in the city of choice.
The third column lists the Median salary across cities Since salary differs with respect to each city and guides you inappropriate Compensation benchmarking across cities.
% Change shows the surge/ tanking from the National Median Salary in that Particular city
For Instance: Salary in Mumbai (42 lacs) is surging by 13.5% from National Median Salary (38 Lacs)
Here you could see 32.9% are in Delhi/NCR and the demand of these roles with respect to each city. If the Demand Exceeds supply, one can:
- Roll out Higher Median Salaries
- Hire from other cities


